Creating the Dust Model
Dust Model Components
In order to determine the most cost-effective way to reduce dust under a limited budget, we had to identify what exposed areas around the Sea will be expected to produce the most dust. We did this by creating a Dust Model, which had three components:
In order to determine the most cost-effective way to reduce dust under a limited budget, we had to identify what exposed areas around the Sea will be expected to produce the most dust. We did this by creating a Dust Model, which had three components:
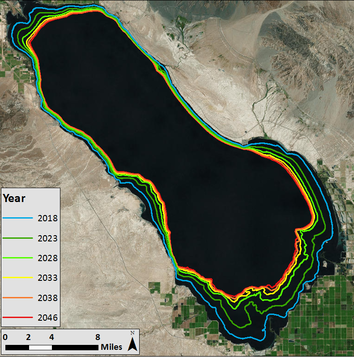
- Future shorelines of the Sea - A tool called the SALSA model was used to determine future sea elevations. These predicted elevations were then used to create the map below to determine how much and where seabed would be exposed in the future at different points.
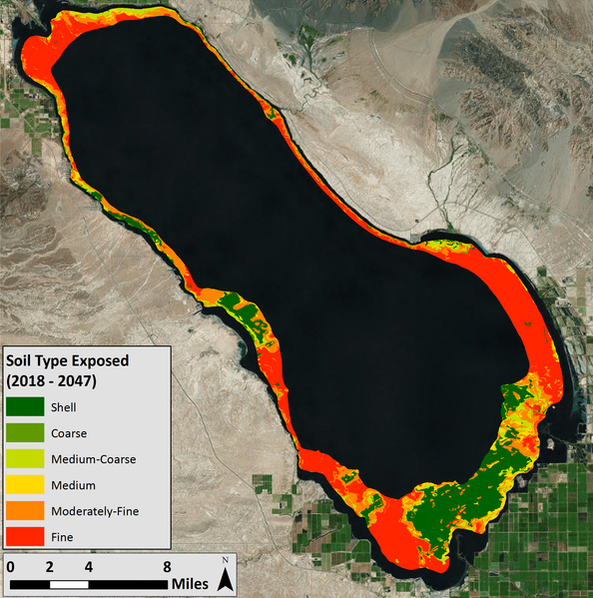
- Soil types of exposed seabed - There are a variety of soil types at the Sea, some of which will contribute to dust storms and some that will not. Finer soils are expected to be more emissive than coarse soils.
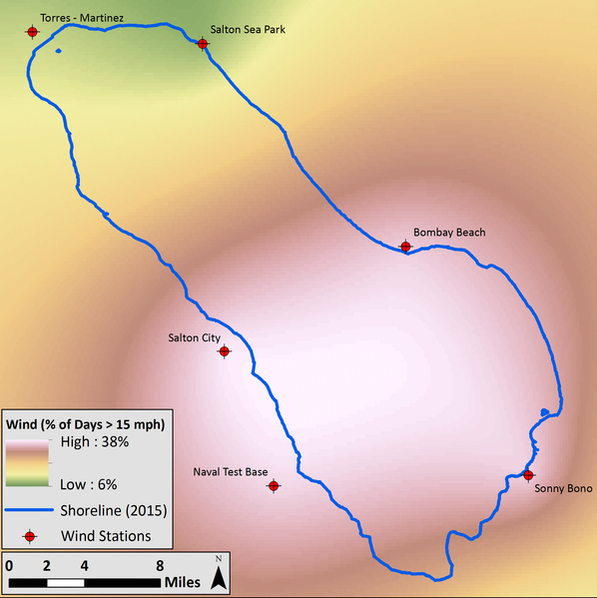
- Wind conditions - Wind speeds vary around the Sea, which means some areas are more vulnerable than others to dust storms.
|
Shoreline
|
Soil Type
|
Wind
|
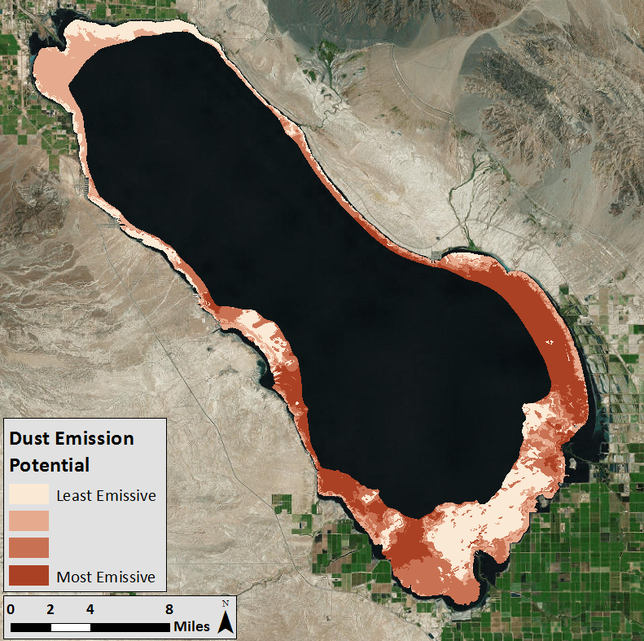
Dust Model Results
After compiling these three components using GIS, we came up with the results of our Dust Model below. The map shows the dust emission potential of future exposed areas around the Sea. The areas indicated in dark red, the southern and eastern parts of the Sea, are expected to create the worst dust conditions compared to other areas. This is expected because these areas are composed of fine-grained soils and are located in windy areas.